Climate change in Guyra
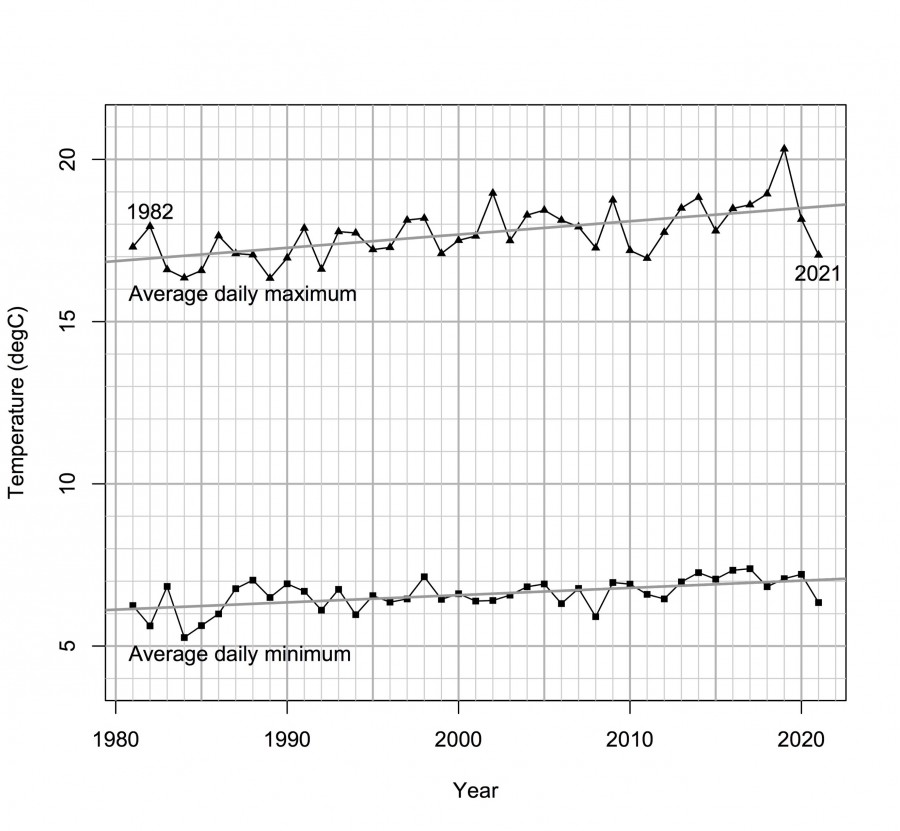
With COP27 and climate change in the news at the moment, readers may be interested in how the climate is changing in Guyra. The daily maximum and daily minimum temperatures for the weather station at Guyra Hospital are available on the BOM’s website. The figures extend from 1/1/1981 to the present. For each year, I calculated the average daily maximum and the average daily minimum. The results are shown in the accompanying diagram. Because the averages jump around a bit from year to year, I have added a straight trend line to each series. These show that the average daily maximum has increased at 0.4 degC per decade since 1981 and the average daily minimum has increased at 0.2 degC per decade.
Of course, you can easily “cherry pick” the data and pretend there is no warming trend by comparing an unusually hot year in the past with a more recent and unusually cool year. For example, compare the average maximum in 1982 (17.9 degC) with that in 2021 (17.0 degC), and you can assert that the climate has cooled by nearly a degree over the last 39 years. This spurious assertion, based on judicious cherry picking of the data, is quite common on denialist websites and has also appeared in the Gazette.
However, it Is possible to make valid comparisons that avoid cherry picking and use all the data. For example, we can compare the twenty years from 1981 to 2000 with the next twenty years from 2001 to 2020. Looking at individual daily maximum temperatures, we find that in the period 1981 to 2000, there were only three days on which the maximum temperature in Guyra exceeded 32degC. In the period 2001 to 2020, there were 26 days on which the maximum temperature exceeded 32degC.
On these measures, there is little doubt that Guyra’s climate has warmed in the last forty years.
Ian Reeve

July 2026
- Record support for Chopper Sheep and Lamb Drive
- New owner continues Harvest Collective’s journey
- Create, Craft, Chat comes to Thriftmas in July
- Census jobs available for Guyra locals
- Nominations open for women who make a difference
- Council partners with ZapCat to help residents reduce energy costs year-round
- Local students part of performing arts success for PLC
- Black Mountain Public School celebrates student achievements
June 2026
- Magic Moment: Guyra Under 10s take centre stage
- Deano’s Smoked Trout to expand thanks to $175,595 grant
- Bowling Club gives back to Guyra community
- Rug up for ‘Thriftmas in July’ Weekend
- Bald Blair wraps up another amazing term
- Trade the desk for the field: Guyra locals encouraged to apply
- Strong community turnout for Guyra grill session
- Mixed emotions as doors to close on local café
- A School Holiday Program Jungle Style
- St Marys get behind Winter Appeal
- Sheep and lamb drive to support rescue helicopter service
- Coalition Pledges support for Feral Pig Funding and Return of Seniors Travel Card
- Outstanding Eisteddfod success for local dancers
- Students inspired at Tamworth Agricultural Careers Expo
- Black Mountain Public School Students attend Dance Workshop
- Power Up Your Future: Apprentice opportunity available in Guyra.
- Registrations closing soon for Thriftmas in July
- Submissions Invited On Sundown Solar Farm
- Five Strong: Medical Centre expands its team
- New Mums turn dream into reality with roadside stall
- Black Mountain Public School marks Reconciliation Week
- Young Spellers Shine at Annual Premier’s Spelling Bee
- Thriftmas in July promotion planned
- PLC Livestock Team celebrates success, service and the future
- Guyra kids share in Nationwide storytime
- Small grant funding available for community projects
- Supporting Northern Tablelands Landcare with $1.7 Million boost
- Hands-on learning experience for students
- Biggest Morning Tea Raises $1,169.50 in Guyra
- Women building futures in Armidale region
- Producers urged to monitor Livestock following rainfall
May 2026
- Impressive performances at school and region
- Guyra Lions have 4500 reasons to say thank you
- Strong results for Wattletop’s return to on-farm sale
- Standing room only at Joyce forum
- Black Mountain Public School Armidale Eisteddfod
- Local Growers Back BioAgPhos S10 Performance
- New Niche Garden unveiled at Guyra Cemetery
- $60 Million Boost for New England REZ Communities
- Bald Blair Public School success at PSSA Zone Cross Country
- Black Mountain Public School at Visual Arts Camp
- New local jobs and expanded services
- Guyra has won my heart
- Strong results at Finlayson Cup Athletics Carnival
- Agriculture Students Shine at Prime Lamb Show
- Warm and cold extremes after driest April in decades
- CWA celebrate success at State Conference
- Debate continues over future use of rail corridor
- Community and Village Grants to support local projects
- Second birthday for the Glen Innes Maternity Group Practice
- Water restrictions tightened amid escalating dry conditions
- Public consultation commences on rail trail framework
- Celebrate Australian Made Week with The Organic T-Shirt
- Community spirit shines through memorial garden
- Just a Farmer screening to lead into Accidental Counsellor course
- Black Mountain Public School Transition Program
April 2026
- Community out in force for Anzac Day March
- 2026 Anzac Day Commemorative Address
- Costa supports local community organisations
- North West Beef Producers Forum 2026 offering timely advice on remaining productive during dry times
- Fairer fees proposed in Draft 2026-27 Budget and Operational Plan
- Dot’s lifetime of service recognised
- New staff and new courses
- New courses to support needs of local community
- Falling dam levels signal dry times ahead
- Donation received by the Rotary Club of Guyra
- 2026 Anzac Day service details
- Favourite Shorts delights audiences at Ben Lomond
- Festival of Small Halls coming to Guyra
- Local wool classer recognised in National competition
- Guyra exhibitors shine in fleece competition at Sydney Royal
- Hockey Club throws support behind Little Frankie
- A year of growth and confidence for 2025 Young Woman
- Pet rabbit owners encouraged to vaccinate against Rabbit Haemorrhagic Disease Virus
- 2026 Anzac Day Services
- Dignity Drive Donations making a difference
- Young auctioneer delivers at Sydney Royal
- Guyra bred steer raises $8000 for charity
- Vinnies farewells long serving manager
- Year 7 Students Take on Lake Ainsworth: A Camp to Remember
March 2026
- Guyra to get innovative heated footpath in Bradley St
- Myles among top young auctioneers at Sydney Royal
- The Perils of Relying on AI: A Lesson from a local
- Young Tiddas program thrives at local schools
- Guyra Central School celebrates Harmony Day, Leadership Induction, and Yarning Circle opening
- Black Mountain Public School – Small Schools Cross Country
- Highly successful NEDGA Golf Tournament
- Guyra rider selected for international exchange
- Deep clean at Water Treatment Plant
- School leaders visit NSW Parliament House
- Landholders Build Skills at Rehydration Bootcamp
- Waterfall Way reopens to one lane of traffic
- Dry conditions starting to bite
- Old schoolhouse finds new life at Black Mountain
- Seniors celebrated at Golden Years Lunch
- Car Club supports BackTrack with Show & Shine donation
- St Columba’s marks foundation stone centenary
- Local Students Shine at Aboriginal Dance Workshop
- Accessing the Best of Both Worlds!
- Feral Pigs run riot while the Government runs another review
- Local women share and learn at IWD event
- Fleece and Fibre Frolic returning for 2026
- Quality cooking entries at Guyra Show
- Guyra fluoride dosing plant temporarily offline
- Kay Endres named Northern Tablelands Woman Of The Year
- Vale: Ronald “Ivil” Reid
- 100 Years Celebration for Saint Columba’s Church
- Strong local contenders at Lamb Show
- Wool Handling competition a standout at Show
- Substantial investment could see 500+ jobs for Guyra
- Hands-on agricultural experience
- Successful Landscape Rehydration Field Day
- Applications now open for village and community grants
- Celebration of Leadership and Achievement
February 2026
- Show time
- Outback stockman a hit at the Show and beyond
- Applications now open for Costa’s 2026 Community Grants
- Black Mountain Public School Leaders 2026
- Level one water restictions now in place
- New manager lands at Armidale Regional Airport
- Aged care transition underway
- Rod Halsted brings his raw honesty and Aussie humour to Guyra Library
- Bald Blair students ready for another year
- Stop by for skin check at the Show
- Smalls schools swimming carnival
- St Mary's swim champions
- Nominations open to recognise our region’s unsung heroes
- Students begin exciting journey
- Exciting events and attractions at the 118th Guyra Show
- Show preparations underway with new faces and leadership
- It’s Not Just You: Community conversation to tackle Perimenopause and Menopause
- Dance classes kick off this week
- New exhibition for local artist
- BreastScreen NSW Mobile Unit Coming to Guyra
- School’s in for St Marys
- Help make a colourful and fun mural for Guyra
- Festival Powered by community volunteers
- BBQ popular at Show and Shine
- Black Mountain back for 2026
- National Servicemen’s Association Day Commemoration Service
January 2026
- Leigh Ramage named Citizen of the Year
- 2026 Australia Day Awards - all the winners
- Organic clothing business puts down local roots
- New bus service connecting Northern Tablelands towns
- 2026 Festival the best since COVID
- Art show continues to grow
- A Festival 40 Years in the making
- Still plenty happening at Lamb and Potato Festival
- Who will be our Citizen of the Year?
- What’s happening in Guyra on Australia Day 2026
- Mulloon Institute Rehydrating Your Farm Landscape program
- Gearing up for milestone Lamb and Potato Festival
- Guyra Central wraps up memorable 2025
- Update on water quality issues
- Preschool Class of 2025 celebrate graduation
- PLC Principal’s Tour and Scholarship Day
- Thank-you from Guyra MPS
- Kids keen to learn sewing
- Australia Day Ambassador announced
December 2025
- Costa celebrates 20 years in Guyra
- St Marys farewell to Year 6 students
- Black Mountain Presentation
- Bald Blair end of year extravaganza
- Guyra Lions Club News
- A year of community-driven wins
- New chapter for Guyra hardware
- A Thank You from Tania and Darren Lennon
- Critical upgrade and maintenance for Guyra Water Treatment Plant underway
- Christmas Message
- From the Archives at the Guyra Museum Compiled by Dorothy Lockyer
- Guyra Lamb and Potato Festival Canteen Duty Roster 2026
- Firies festive Lolly Run a hit
- Guyra MPS staff and residents support Can Assist with donation
- Black Mountain Nursery marks 40-Year Milestone
- Christmas Carnival promises fun for all
- Fiori Musicali brings Christmas spirit to Guyra with “This Endris Night”
- Calling for nominations for Christmas Lights Competition
- From the Archives at the Guyra Museum Compiled by Dorothy Lockyer
November 2025
- Council delivers trio of bridge upgrades
- Colour run fun at St Marys
- Community mourns Rev. Andrew Campbell
- Bank Merger given green light by members
- Service milestones recognised at Can Assist Guyra
- Firies seeking spare change to help young burn survivors
- Local group raises concerns after asbestos-containing parts found in wind turbines
- Funding to celebrate Seniors in Guyra
- Packing party delivers the goods for dignity
- Ben Lomond Public School to go into recess in 2025
- RFS lolly run set to spread Christmas Cheer
- Get ready for festive fun with ‘Bikie’ Santa
- Budding Scientists at Bald Blair Public School
- Black Mountain Public School celebrates Student Leadership and Remembrance
- Graduates mark milestone with formal celebration
- Ribbon cut on saleyards upgrade
- Concerned about new energy infrastructure?
- New addition welcomed to Guyra Preschool family
- Rotary Christmas Carnival returns December 5th
- Students explore science at UNE’s Far Out Science Day
- From the Archives at the Guyra Museum Compiled by Dorothy Lockyer
- Leadership celebrated at annual lunch
- Thundercloud to take the stage at Bush Poetry Championships
- Seasonal update brings together landholders and industry experts
- First novel for local author - ‘The Girls of Redgum Bay’
- Moylan calls into Ben Ben Lomond on quick visit
- Next chapter for Progress Association
- $9.6 million highway safety project complete
October 2025
- Council commits to rail trail study
- Bald Blair Students Embrace Wellbeing with Healthy Harold
- St Marys students Step Up for Socktober
- Bags and Beans: Supporting Women in Need
- Barriers to Trees on Farms: Discussion evening in Guyra
- From the Archives at the Guyra Museum Compiled by Dorothy Lockyer
- Rebates flow for rainwater tanks in Armidale Region
- World record attempt falls just short
- Guyra Fire & Rescue gives back with donation
- Last chance to support Mango Fundraiser
- Progress Association welcomes new executive
- Exciting Start to School for Transition to Kindergarten Students at Bald Blair
- From the Archives at the Guyra Museum Compiled by Dorothy Lockyer
- Guyra golfers tee up for Centenary celebration
- Trees, Power and Proof: What Australia’s Climate Policy means for New England Graziers
- All the prize winners from TroutFest 2025
- Quiet please - HSC exams start Thursday
- Strong community backing for Tingha Playground Upgrades
- Black Mountain Public School Welcome Back to Term 4
- From the Archives at the Guyra Museum Compiled by Dorothy Lockyer
- Research partnership earns international recognition
- Big Day Trout makes a splash at Guyra TroutFest
- Common-sense reform for farm firefighting vehicles
- Creative Streets takes flight with aerial acts
- Black Mountain Public School wraps up a busy Term 3
- WA Mechanic visits on his year off
September 2025
- Farewell to the Class of 2025
- Community Spirit Shines at CPP Event in Guyra
- Bowling Club Cabins ready for first guests
- Costa Glasshouse win at business awards
- Cadillacs turn heads as they cruise into Guyra
- Five generations come together
- Pop-Up Shop opens in a Flash of Lightning
- Bright colours and big smiles at Colour Run
- Team Guyra Chopper ride tops $21,000
- St Mary of the Angels students explore Canberra
- Sustainable Agriculture in Focus at Ben Lomond
- NSW SES urges you to create a plan this storm season
- From the Guyra Archives held at the Guyra Museum compiled Dorothy Lockyer
- Guyra truckie inducted into Transport Wall of Fame
- Educator recognised in National Family Day Care awards
- Joyce celebrates a Century
- Locals named as PLC student leaders
- Transition program underway at St Marys
- A class act - Year 12 graduates to be celebrated at Council event
- Double premiership glory for Junior League
- Another big year for Guyra Can Assist
- Dragons inspire students during ‘The Best You Can Be’ Blitz
- Tenterden Hall to celebrate 100 Years
- Auto detailer sets up in town
- Stop Motion Animation workshop for teens
- BALD BLAIR:Father’s Day BBQ brings community together
- ST MARYS: Book parade follows Father’s Day breakfast
- New home for‘Our Little Gallery’
- ‘Big Day Trout’ Music Festival and Mirrorball
- Bush Fire Danger Period has started
- Guyra landfill rehabilitation ‘a major win’
- Food safety training opens doors for hospitality workers
- Black Mountain Book Week Parade
- Bald Blair students represent North-West Athletics Trials
August 2025
- $7,900 Raised for Chopper in its 25th year
- CWA Community Grants are back!
- Strong results at working dog auction
- Disaster Assistance extended following August snowstorm
- Finalists announced for 2025 Business Awards
- $300,000 to rehabilitate Guyra Landfill
- Bald Blair students ‘Book an Adventure’
- World Cup success for Fletch
- Students Decode the Universe
- Permanent memorial for long forgotten graves
- Ride for the Chopper Sheep and Lamb Drive
- Vision to restore Little Boy Lost landmark
- Free health checks next week
- New England District Exercise descends on Bundarra this weekend
- Introducing New Koala Conservation Officer: Thaw Ni Ni Zaw
- Sybil Prisk turns 100 – A Life Well Lived
- Elders grant boosts VRA with life-saving equipment
- Armidale and Guyra still waiting for disaster declaration following Snowstorm
- Education Week Celebrations at Bald Blair
- Thank you for your support Guyra community – 2025 Snow Ball
- Ignite your Potential - Celebrating Public Education Week
- Black Mountain Public School –Celebrates Education Week
- Young cattle enthusiasts invited to hands-on camp
- Magical day as snow blankets the tablelands
- Delight and disappointment as winter storm hits
- Emergency services put to the test
- Snowstorm Stories: from coastal commutes to childhood wonder
- Early commencement program inspires local students
- Moylan visits Guyra to inspect Mother of Ducks
- Paddy O’Brien returns for TroutFest
- Council seeks community input
July 2025
- NSW Emergency Services community awards finalist
- New leadership for Show Society
- Josephine Wants to Dance theatre production enjoyed by Bald Blair students
- Guyra woolgrowers shine at National Fleece Competition
- Man charged after drugs, firearms seized
- Village and community grants open to support projects across the region
- Bridgewater Angus Bulls top at $30,000
- Guyra TroutFest seeks volunteers for 2025 Festival
- Council demands fair deal on renewables
- Strong community support for Heritage Train
- Permanent variation to Bush Fire Danger Period
- Jam-Packed Entertainment program for TroutFest
- Improved access to Centrelink Services
- OUR HISTORY - McMullen’s Store
- NAIDOC Week celebrations bring joy for youngsters
- A century of service, stories, and stage
- New rescue gear a game changer for VRA
- Team Guyra Saddles Up
- National Desexing Month - call to prevent unwanted litters
- Digital Water Meters rolling out in Guyra
- Lotus Grand Tour brings classic thrills to town
- Winter school holiday program offers fun and learning across the region
- Afternoon basketball program a great success
- Local students on the job
- Snow Ball returns for 2025
- Black Mountain Public School Final Assembly Term 2
- Rotary honours Kanaley at changeover
- Lotus Grand Tour heading to Guyra
- Help keep our train on the tracks
- Mateship, Music and Men’s Health
- Curtis Park Playground upgrade complete
- Scammers Strike During Tax Time: ATO Warns Australians to Stay Vigilant
- Call for Nominations: Japan-Australia Grassroots Exchange Program 2026
- Let’s Hang It 2025
- Vounteers share the load at Guyra HSS
- St Mary’s news
June 2025
- First Ever Dolly’s Dream and VRA round for Junior Spuds
- A Fresh Taste for Guyra with a Warm Welcome
- Join us in making a difference in Guyra
- Intergenerational experience
- Black Mountain student enjoys Visual Arts Camp
- Wrap up of GCS Cross Country events
- A day of storytelling and connection
- New service station proposed for Llangothlin
- Neighbourhood Centre introduces ‘Breakfast Bar’
- St Mary’s news
- Ben Lomond RFS welcomes new Fire Truck
- New frost-free record for May
- Long weekend brings first snowfall
- Information sessions for proposed Boorolong Wind Farm
- Premier’s Spelling Bee
- Work Experience success
- Armidale Regional Council supports flood recovery
- Free community workshops to support disaster resilience and recovery
- Annual four-month trout fishing closure from June 10
- Shakespeare’s Twelfth Night performances in July
- Leadership transition underway at GALA
- State Champions at Shakespeare Carnival
- Helping Seniors Stay Safe Online
- Confirmation congratulations for local students
- Road crews on the way
- Joyce formally declared winner
- Calls Grow for Urgent Action on Feral Pig Crisis
May 2025
- Storytime shared with others around the country
- Volunteers celebrated in National Volunteer Week
- Relief on the way for roads after flood traffic diversions
- TroutFest on the lookout for talent
- Nominations open for New England North West Business Awards
- Students join 2025 National Walk Safely to School Day
- Three nominations for 2025 AgShows Awards
- First GuyrARTists exhibition hits the mark
- On the job training with the Gazette
- Vale Jim Betts 21/4/1944 ~ 27/4/2025
- Group fox baiting program returns
- Guyra Central shines at Prime Lamb competition
- Bridge works commence
- Career Expo inspires Guyra students
- Global Delegates visit Bald Blair Angus
- Guyra woolgrowers successful at Sydney
- Celebrating the Mother in us all
- Join Guyra’s Biggest Morning Tea
- St Marys Mother’s Day Breakfast
- Celebrating Mothers at Bald Blair
- Barnaby back, but still in oppostion
- GuyrARTists plan for their first Art Show
- Keeping New England motorcyclists safer
- Success at Polding winter trials
- Black Mountain Public School News
- CWA gather in Guyra for Group judging
- Virtual fencing now legal in NSW
- Support The Salvation Army’s 61st Red Shield Appeal
April 2025
- Strong support for ANZAC tradition
- Guyra team smashes Tour de Rocks 2025
- ARC calls for funding to support NEREZ growth
- Costa supports local schools to access kitchen garden program
- Autumn colours set to shine on Garden Trail
- Guyra swimmer competes on the big stage
- UNE Voyager Discovery Bus visits Bald Blair
- Remembering our Vietnam Veterans
- Glen Innes prepares for 2025 Celtic Festival
- Mathematics with Mr Wilson
- Biggest Morning Tea returns
- First-of-its-kind rescue event held in Guyra
- Pedigree and Companion Cat Show lands in Guyra for the first time
- Easter Egg-citement and Hats on parade
- Rugby stars shine in undefeated Barbarian team
- ANZAC Day Services in Guyra
- Easter Messages
- Large turnout for public forum
- 337SQN Australian Air Force Cadets visit Guyra
- Mal calls time on spreading fertiliser
- Museum visit for St Mary’s students
- Visit to Armidale Gymnastics Centre
- New maternity and pregnancy options for women of Guyra
- Action-packed school holiday program
- Beyond Blue Car Rally calls in
- Sea of Green for St Patricks Day
- Council puts out call for social housing development
- Signed 2024 Knights Jersey up for grabs
- Small Schools Cross Country
- Winter trial success for St Mary's students
March 2025
- Cross Country champs
- Anglers Club wraps up successful year
- Tickets on sale for autumn garden trail across New England
- Greens announce federal candidate
- Free Life-Saving Training on Suicide Alertness
- Fleece & Fibre Frolic a big success
- Study day valuable for senior students
- Free writing competition for country residents
- Scout Hall restoration reaches next stage
- Get ready to Frolic this weekend!
- Have a Koala-themed Beer with Guest Speakers
- Multimillion-dollar benefit sharing deal
- Youth Refuge and Community College success
- After School Activities Program
- Black Mountain School leaders for 2025
- St Mary's swimmers perform well
- Youth of the Year regional finals
- Firefighters pass on raffle proceeds to Can Assist
- Clean-up Australia Day
- Guyra Show 2025 Wool results
- Guyra Show 2025 Shearing results
- Guyra Show 2025 Cooking
- Students showcase their talents across the region
- Bach’s St Matthew Passion – music for Easter
- A night of generosity and hope
- New festival to celebrate fibre arts
- Guyra Show - Horticulture
- Launch events for local author
- Seniors invited to join ‘Mystery Trip’
- Guyra Show 2025 - Woodchop
February 2025
- 117th Guyra Show a big hit
- Lamb Show attracts great interest
- Free skin checks well supported
- Guyra Show Poultry
- Costa supports local community organisations
- 41st Armidale Eisteddfod entries open
- Parliamentary committee to consider splitting Hunter New England Health
- Small schools swimming carnival
- Funding boost for sporting star
- Hospital auxiliary hands over new equipment for Guyra MPS
- Dance classes return for 2025
- Date set for TroutFest 2025
- Tips to help keep pets safe during firework displays
- AGM coming up for Guyra ratepayer group
- St Marys swim champs
- Scaling new heights with VRA Rescue
- Little Boy Found 65 years ago
- Laura Hughes announced as Labor Candidate for New England
- St Mary's welcome BBQ and Mass
- Twice the Expo, one huge weekend
- School’s Back for 2025
- Councillors drop in to Guyra Cafe
- Apprentice kicks off career with CT Electric
- New management team for Rafters
- Canteen’s Healthy Transformation recognised
- Monthly Church services to resume at Black Mountain
- Rail trail supporters are ready to assist
- Nominate an outstanding senior for local achievement awards
January 2025
- Australia Day awards and recognition
- Big crowds for Show and Shine
- Community funding on offer from Costa
- Who cooks the lamb?
- Opinion - Barnaby Joyce MP
- Curtis Park Playground expansion to commence
- New Year, New Look Pantry
- Meet our Australia Day Ambassador
- 2025 Citizen of the Year nominees
- Improved water access for property firefighting
- Industry networking and advice at Feeder Steer School
- Festival time is here
- Guyra water gets tick of approval
- DO YOU KNOW THE NEW BUSH FIRE DANGER LEVELS?
- Art Show opening night
- 2024 - Guyra’s second warmest year on record
- Crafty locals selling their wares
- Vinnies used as dumping ground again
- Council reaps rewards from new energy contract
- Have a say on proposed coach timetable changes
December 2024
- Bigger, brighter, better fireworks
- Guyra Central’s year ends on a high note
- Report commissioned into Guyra’s water supply
- Bald Blair Public School Celebration of Learning
- St Mary of the Angels Presentation night
- New electric vehicles added to council fleet
- Black Mountain Public School K-2 Farm to Family
- Lights on at Black Mountain
- Carnival goers Jingle all the way
- Tradition continues with January Festival
- Preschoolers ready for next step
- Life Education Van visits Black Mountain
- Can Assist Life membership for Jackson
- Blue-green algae Red Alert for Malpas Dam
- A message from NSW Rural Fire Service Commissioner, Rob Rogers AFSM
- Endangered Bell’s Turtles captured
- Fiori Musicali Chamber Choir to Sing Alleluia in Guyra
November 2024
- Funding pulled, but councils remain committed to Rail Trail
- Farm succession survey launched
- New Community Care Chaplain for Guyra
- Bald Blair Year 6 farewell Primary School
- Nominate now for Australia Day awards
- Tiny Church will be all aglow this Christmas
- Enter now for CWA Art Show
- Swim School week
- Free legal aid diary available
- School’s out for Class of 2024
- Promise made, promise kept
- History made at Guyra saleyards
- Festive cheer, lights and Santa return at Guyra Christmas Carnival
- Guyra’s Class of 1974 reunite
- Author talk at Guyra library
- Make Christmas brighter
- Posthumous award for Guyra aviator
- Work progressing on old Scout hall
- Career Expo at Guyra Central School
- School leaders lunch with local member
- Glen Innes takes step forward on Rail Trail
- Remembrance Day Ceremony
- Exploring local business production
- Spring Garden Trail ‘truly astounding’
- Fantastic formal for Year 10 students
- Fantastic weekend at New England Sings
- War Memorial Hall -104 years old
- Runners up at Diocesan Touch Football Carnival
- Join RSL sub-Branch for Remembrance Day on Monday, November 11th
- Poetry Workshops for Young and Old
- Picnic at Llangothlin Nature Reserve
- Guyra Can Assist President’s Report 2024
October 2024
- Vets tournament set to become yearly event
- Biosecurity On-Farm: A Practical Perspective
- Headspace visit engages students
- Show Society looking for young women
- New parking app launched at Armidale Airport
- Remembrance Day is Monday, 11th November
- St Marys join New England Sings!
- Hunt on for new General Manager
- Deadly day at St Marys
- Oh what a night for rural women
- Over 75s in the swim with free pool entry
- Permaculture workshops at Community Garden
- Free mulch for residents
- Black Mountain Music Program
- Region chiselling out a place as top tourism hotspot
- Building the Tingha community spirit
- President’s report - CWA Evening Branch
- Ragavi Jeyakumar awarded Rhodes Scholarship
- A Fin-tastic fortnight of fishing for Guyra Anglers
- First meeting for new council
- St Mary of the Angels Open Day
- Picnic in Nature at Little Llangothlin
- Garden trail through New England
- TroutFest draws visitors to town
- TroutFest Art Show
- Tradies breakfast
- Looking for rural women to represent Guyra
- New school leaders for 2024-2025
- Year 12 Class of 2024 farewelled
- Frocking Fabulous: Rural Women’s Day in Guyra
- Results are in for council election
- TroutFest action this weekend
- SWOOPING SEASON IS NIGH!
- Guyra Warmer than Armidale?
September 2024
- Spring into library for school holiday fun
- ‘Guyra what a wonderful community’
- Residents urged to ‘Get Ready’ for the return of bush fires
- Full week of activities for NAIDOC week
- Moylan calls for local input on the integrated transport plan
- Community response to Mental Health workshops highlights need for more training
- Building bridges for communities
- Election delivers a mix of old and new
- Young shearer headed to New Zealand
- Regional Australia Bank Celebrates in Guyra
- Landholders and residents ask ‘Is the New England REZ Broken?’
- Community encouraged to revisit Armidale Region’s Community Plan
- ‘Give a Sheet’ for the planet
- Fiori Musicali to perform ‘Misa a Buenos Aires’ in Guyra
- Bloat and pulpy kidney are ‘spring killers’
- After School Activities Program
- Records broken - warmest August night on record
- ‘Boys on the bus’ work to beautify Guyra
- Information morning well supported
- Carpark getting a makeover
- More homes in Guyra get access to faster fixed wireless connections
- Mid Term Assembly at Black Mountain
- Glenrac’s Free Fit farmers event
- Guyra Mill changes hands
- Working Dog Auction tops at $8600
- Riders ready for charity ride
- Crochet and chat over a cuppa at new library event
- How to make your vote count
- Brain Olympia success for St Marys
August 2024
- Guyra girls lift the trophy
- The Wardrobe Project a great success
- Something new for Children and Youth Art
- Unique Yarns come to Guyra
- Black Mountain Public School Book Week Parade
- Men’s Health Education Rural Van visit to Guyra
- Knitting with Resilience Workshop
- Last stop for e-scooter trial
- What’s happening at the Royal?
- Thirty nine candidates to battle it out for nine spots on council
- A fantastic French themed evening
- Let there be light at new free festival this weekend
- Nominate ‘unsung heroes’ for Australia Day awards
- Black Mountain students enjoy Thalgarrah Excursion
- ‘Proud to Belong’ at Guyra Central
- ‘Harvest Collective’ - old space, new idea
- Black Mountain Education Week Activities
- Art workshops for TroutFest
- CWA giving back through community grants
- Behind the scenes at Armidale Regional Airport
- Athletics success for St Marys
- New name request for Guyra Park
- Rail Trail Friends launch in Guyra
- Water budgeting: calculate your stock water requirements
- Explore Advances in Soil Health with the Experts
- Yards ahead with upgrades to livestock facilities
- New dining option for Guyra
- Butchery changes hands
- Bridgewater Bulls top at $16000
- 100 Days Smarter at Guyra Central
- A Night of Song: “The Flower and the Fiddle”
- Black Mountain Public School K-2 Excursion
- Ben Lomond bids farewell to local couple
- Supporting rural men with Mental health
- Time to Share the Dignity again
- Still time to book tickets for Combined services dinner
July 2024
- Garden festival expands to attract more visitors
- St Marys celebrate 100 days of learning
- Reduced aviation fees at Armidale Airport take off
- Local government elections draw near
- Launch events for Friends of New England Rail Trail
- Black Mountain Public School’s Coffs Coast Adventure
- Wildlife Tails
- Get involved in season three of Muster Dogs
- Appeal for information into the 2009 disappearance of George Ross - Missing Persons Week
- OUR HISTORY: Guyra Law and Order
- New Natural Capital Advisor for the Northern Tablelands supports farmers to better manage natural capital
- Guyra wool shines in competition
- Beth White ordained an Elder
- Parli-Flicks invites NSW students to define democracy in one minute
- New kitchen on the menu for BackTrack
- Concerns about proposed changes to Native Vegetation Laws
- Support for New England Veteran Advocacy Services
- Red Letter Day for Wool Sales at Guyra in 1936
- Time is ripe for new approach to fresh produce exports
- Prior preparation the key to a successful calving season
- Let it Snow!
- Applications open for 2025 intake
- A history of Guyra Post Office
- Public forum on council demerger
- Dalby Hereford Youth Camp
- Assistance needed for skate park upgrade
- Discover Your Voice at the Australian Poetry Slam Heat!
- Council Small Grants program funds community initiatives
- Black Mountain Public School
- St Mary of the Angels
- A History of the Guyra Fire Brigade
- Outdoor STEM at Bald Blair
- Success at National Championships for Guyra Polocrosse
- Sports Shear fundraiser
- GCS Multicultural Perspectives Public Speaking Competition
June 2024
- Nationals retain Northern Tablelands
- Garden Club helps out vital service
- St Mary's students complete Sacraments
- Farmers better equipped for changing climate
- Are you missing out on free help for your country small business?
- Black Mountain Public School Mid Term Assembly
- Rotary welcomes new team
- New release for local children’s book author
- Greens MLC to speak at Guyra meeting
- Emergency apps available now to download free
- Council seeks feedback on two new Draft Strategies
- Free mental health first aid courses
- Landholder collaboration key to controlling foxes
- Black Mountain Public School success at Armidale Eisteddfod
- Five names on the ballot paper
- Reconciliation Week Celebrations at Black Mountain
- New employment opportunities for First Nations people
- Committee appointment for Aileen MacDonald
- Guyra Lions Club President’s report
- Morning tea raises funds for cancer research
- Community connects for Reconciliation Week
- Funds flow for Scout Hall ‘facelift’
- National Simultaneous Storytime
- St Mary's perform well at Rugby trials
- Armidale Zone Cross Country
- First Frost - late but not a record
- Applications open for Community Small Grants
May 2024
- Big win for Guyra Polocrosse at State titles
- Great enthusiasm for athletics
- Guyra volunteers celebrated
- Learning new skills at Guyra Central
- Black Mountain success at Finlayson Cup
- OPINION: Rail Trail still a long way from reality
- Neighbourhood Centre Information Day a success
- Successful Biggest Morning Tea Fundraiser
- Council’s draft budget on public exhibition
- Mother’s Day Pamper afternoon
- ‘Modified’ Rail Trail looks set to go ahead after decision overturned
- Eisteddfod celebrating 40th year
- Reading from the same page at storytime event
- Older people urged to be prepared for the winter season
- Pedestrian safety under the spotlight
- Team Guyra raise $4000 during challenging TDR
- Guyra IGA supporting fundraising for Special Olympians
- Mother’s Day pamper session
- High Tea for Mums
- Big Chill Festival – so much more than great music
- Bald Blair Public School welcomes Transition students
- 14th annual Bridge Walk scheduled for May 26th
- Nature night a ribbiting success
- Students share Anzac spirit with Kolora residents
- Council to explore private market for Preschool construction and operation
- Nationals preselect Brendan Moylan for Northern Tablelands By-Election
- Tesltra services disrupted by upgrade works
- War of words (and a rescission motion) after vote to delay decision on rail trail
- Marathon - Kate thanks supporters
- CWA members head to Coffs Harbour for annual conference
- Costa thanks Community Reference Group
- Take the plunge at Big Chill event
- Schools’ Prime Lamb Competition
- Schools march with pride on Anzac Day
April 2024
- Anzac Day 2024
- Autumn at Ollera draws the crowds
- Anzac Day Commemorative Address 2024
- Biggest Morning Tea in Guyra May 15th
- Ebor Falls upgrade official opening this weekend
- Ollera garden open this weekend
- Soldier honoured to return home for Anzac Day
- New guidelines for City 2 Soil bins
- Beryl turns 102 years young
- Good news for local businesses
- Long term social consequences of war
- RAS Rural Achiever shares passion for agriculture with Guyra students
- Easter Delivery to McLean Care Kolora Aged Care
- Winning photo features Guyra Church
- Bradley Street footpath cleaning to start this week
- Artificial hollows installed as new homes for Guyra gliders
- ANZAC Day Services
- World class concert coming to Guyra
- PAWS UP Back Track dogs visits Black Mountain
- Timely warning from New England Police
- GLENRAC’s Emergency Redi kicks off Proactive Workshop series
- Autumn colour on show
- New Toy Collection comes into play
- Tour de Rocks riders heading to the coast again
- Marshall to call time on two decades of politics next month
- ANZAC Day in Guyra
- Life’s a beach - Dumaresq Dam Reserve official opening
- Black Mountain Public School Harmony Day Celebrations 2024
- Warning to watch out for fake email invoices
- Seed orchards to conserve threatened eucalypt populations
- Free event to celebrate Koala Habitat Planting
- NSW Farmers supporting rural leaders
- Local woolgowers take out top award at Royal Easter Show
- Northern Districts third win in five years
- Fine knitting wins two top awards in Sydney
- Fiori Musicali presents “Treasures from the Baroque” in Guyra
- Nature night for families
- Meeting provides clarity for plans to build rail trail
- Bald Blair shines at Snow Gums Cross Country Event
March 2024
- Costa product innovation centre launched
- A busy start to 2024 for Agriculture students
- Momentum program coming to Guyra and Tingha
- Harding Miller Scholarship awarded to Guyra Central School student
- And the winner is?
- Demerger protest held outside State Parliament
- Seniors enjoy a day out thanks to Lions Club
- Make your voice heard: Rural & Regional crime inquiry begins
- Black Mountain Public School Gymnastics Centre Visit
- Guyra shooters excel at Nationals
- Highlands Science and Engineering Challenge
- Volunteers needed for poetry events
- St Marys celebrate St Patrick’s Day
- Black Mountain Public School Leaders for 2024
- PSYCHS ON BIKES: Riding towards mental wellness in Rural Australia
- 3G shutdown - Don’t disconnect the bush
- Guyra puts their lambs on Show
- Level 1 water restrictions now apply for residents
- Cultural excitement for April/May
- Local action group to now represent ratepayers
- 116th Guyra Show - Yard Dog Trials
- Diocesan Winter Trials
- Black Mountain Public School Show Entries
- 116th Guyra Show - Poultry
- NSW Women’s Week launch
- Planning & contingencies key to stock water systems
- Costa awards funding to community groups
- 116th Guyra Show - Horticulture
- Vinnies need you
- 116th Guyra Show - Horse Events
- 116th Guyra Show - Cattle
February 2024
- S&GG says all may not be lost
- Youth of the Year regional final held in Guyra
- Workshop a blooming success
- 116th Guyra Show - Shearing
- 116th Guyra Show - Wood Chop
- 116th Guyra Show - Cooking
- 116th Guyra Show - Wool results
- Small town puts on a big Show
- New Ebor Falls upper deck viewing platform now open
- Dance classes set to start
- Rex Airlines extends suspension until October
- Inspired to run for cancer research
- Guyra Show hosts Zone Junior Judging
- FREE ‘AG.Biz Ready’ Program open to all Northern Tablelands Farmers
- Bald Blair students artworks on Show
- Small Schools Swimming Carnival
- Council releases new strategic plan
- Shearers pitch in, in time of need
- Tips and tricks for budding bakers
- Transition Program 2024
- Changes for Jobs Australia Enterprises
- Empowering girls to reach their potential
- Country Shows
- New Year, New Faces at local schools
- Young woman hopes to inspire others
- New laws to remove roadblock to demergers
- Bald Blair Public School Welcome to 2024
- New life members for Show Society
January 2024
- Margaret Grills named top citizen
- OAM for Hans Hietbrink
- Old cars needed to help with training
- Skywalk opens in Glen Innes
- Tingha Australia Day Awards
- Rotary hosts Brazilian exchange student
- Poetry takes a leap into the digital age
- Who is the thief?
- Fabulous day at January produce swap
- Festival committee farewells stalwarts
- CWA Evening Branch art exhibition
- Community Grants Program
- Getting ready for the Guyra Show
- Come and visit the Guyra Museum
- Who will be our 2024 Citizen of the Year?
- Festival at capacity in 2024
- 2024 Australia Day Ambassador
- New England Wedding Showcase
- Christmas celebration for Costa staff
- Land values increase across Northern Tablelands
- Guyra 2023 weather summary
- Xmas lights winners
December 2023
- Preschoolers graduate top of the class
- Kirk family checks out for final time
- End of an era for Donna’s Bistro
- CWA Art Exhibition is on again in January
- St Mary's Presentation evening
- Bald Blair Public School Celebration of Learning
- Family celebration for 60th wedding anniversary
- Old friends meet again
- Dancers end year with Disney performance
- Festive community lunch a winner
- Final preparations for Lamb and Potato Festival underway
- Colour Explosion School Run 4 Fun
- Progess for Guyra & Community Progress Association
- Wildlife Tails
- $4.73 million shot-in-the-arm for road repairs in Guyra and Armidale
- Street party heralds festive season
- Black Mountain Public School Mega Band Day
- Pothole program reaches record levels with 10,000 potholes filled in recent months
- RFS Santa’s Lolly run
November 2023
- Join the fun at the Christmas Carnival
- St Marys peforming arts night
- Scout Hall to get new lease on life
- TroutFest praised in Parliament
- Lions Youth of the Year Quest
- 90th birthday celebrations
- Farmers forum unpacks windfarm issues
- Get your nominations in before it is too late
- Samoan’s sing for Christmas
- Festival celebrates Bush Poetry tradition
- New yarn in stock at Our Little Gallery
- Demerger hopes rest with Greens MLC
- Black Mountain Public School Inspired Readers Festival
- Sky’s the limit for new aviation school
- Country Women’s Association backs CMA call for inquiry
- NSW Farmers welcomes $250 million Drought Fund
- Memorial Park now a reality
- The story of the Rotunda
- Christmas vouchers for community
- Grandparents Day at St Marys
- Free Mulch weekends
- Remembrance Day ceremony
- Bald Blair student shines at national competition
- Catch fish, not birds
- Celebration Time for Year 12 Students!
- New and old get together in Guyra
- Get ready to unwrap the magic of Christmas
- Family auction ends 109 year affiliation
- Save and Grow Guyra awaiting response from Minister for Local Government
- REX: Not goodbye, just see you later
- Black Mountain Public School Welcomes Practicum Student
- Guyra Evening CWA creates history
- Guyra CWA President’s report
October 2023
- What Living in Guyra has done for us
- Changes to drought management plan
- Avoiding an energy blunder downunder
- Poets on the Mountain Festival
- Memorial Park opening on Remembrance Day
- Remembrance Day services in Guyra
- Personal bests at State Athletics Carnival
- Renewable energy projects must provide benefits
- Frocked up for a good cause
- Guyra student’s excel in Statewide competition
- Free community BBQ this Sunday
- Tremane joins the Guyra Central team
- Petition to restore trains north of Armidale
- Are you ready to Frock Up?
- Don’t miss this great opportunity
- Come sing with us
- Picnic in Nature
- Bringing mental health awareness to the community
- Call for Parliamentary Inquiry to address crime in regional NSW
- Black Mountain Public School Transition News
- Regional seniors travel card petition tabled in State parliament
- Enjoy a ‘Picnic in Nature’ at Little Llangothlin
- Total clearance at working dog auction
- Guyra RSL sub-Branch may have to close
- TroutFest committee says thanks
- Family needs help in wake of tragedy
- Bald Blair Public School Success at Trout Festival
- Ingrid in Mexico – September report
- New road safety initiative
- OPINION: The Lunacy of Climate Cult’s 100 per cent Renewables
- JUST 1 month until - IT’s in the BAG
- New plantings and Rotunda now in place
- Progress Association News
- CWA Evening Branch AGM
- Nominate a worthy citizen for Australia Day Awards
- GLENRAC continues a proud tradition with the 2023 Rural Women’s Day
- Spooktacular Halloween event planned
- Black Mountain Public School Busy Start to Term 4
- Yes or No? Cast your vote in the referendum this Saturday
- Rural Aid encourages farmer registrations as El Nino is declared
- Wildlife Tails
- Role models, friends farewelled
- Councillors support Mayor for second term
- TroutFest Art Show
- Electricity network maintenance
- Band Workshop and Learning Kamilaroi Language for Black Mountain students
September 2023
- Ride for the Chopper passes through
- Costa group agrees to $1.5 billion takeover
- Understanding Farm Fire Units
- Can you help rediscover the Yellow Spotted Bell Frog?
- New manager and opening hours for Guyra Pool
- Conversations and a cuppa for RUOK? Day
- Reeling in the tourists at new Visitor Centre
- TroutFest Karaoke Party
- It only takes one spark to start a fire
- St Marys attend soccer Gala Day
- New Owner for Guyra Rural Services
- Ray White Rural & Livestock Awards
- National Emergency Medal presented to local firefighters
- Fruity Fun at St Mary of the Angels
- Raising funds for the Westpac Chopper
- NAIDOC Week Celebrations
- Rehydrating Workshop for Landowners
- Aboriginal rangers looking after country
- CWA Step into Spring
- Free information day for farmers
- Introducing Recycled Style – recycling clothes for a sustainable future
- Father’s Day Frisbee Golf Afternoon
August 2023
- Book Week Dress Ups
- TroutFest planning a great long weekend
- New England District RFS members honoured for service
- Estimating Herbage Mass with Drought Resilient Pasture Landscapes
- Celebrating 175 years of Public Education
- Residents urged to adopt sustainable water practices
- Cyclists seek support ahead of 2023 ‘Ride for the Chopper’
- Stolen fuel leads to car chase
- St Mary’s students athletics success
- New England Garden Festival predicted to attract large crowds
- Awards handed out at Black Mountain
- Shearing for beginners
- Bank backs local community with cash
- Successful day for Glenavon Angus
- Protesters rally outside Tamworth Bush Summit
- Sporting program rolls out at St Mary’s
- Black Mountain Highland Fling
- Guyra Evening CWA represented at State event
- New England graziers preparing for the next drought
- Thomas Mayo to speak at Armidale reconciliation event
- New lease of life for butchery
- Guyra Snow Ball a great success
- The ‘bikes’ are back
- Rotary Club begins new term
- Guyra students perform well in Spelling Bee
- Funky sock fundraiser
- Local buyers top bidders at Bridgewater sale
- Glenrac’s Farmer update is back
- Ratepayers urged to get involved
- Call for highway rest stops in the New England
- 100 days of school
- Bush Fire Danger period commences
- New name, new lease on life
- Horticultural qualifications for Costa employees
- Ingrid in Mexico - July Report
- ‘For our Elders’- Local schools mark NAIDOC week
- PAWS UP visit Black Mountain Public School
July 2023
- Refurbished Men’s Shed officially open
- Ehanced entrances to Guyra now complete
- Funds boosted ahead of Drover’s Run adventure
- Charity Jersey framed
- Men’s Health Van returns to Guyra
- Enormous effort at Cross Country
- Sale O! - Bulls season arrives for local studs
- Glenrac welcomes new project officer
- Pete’s new ditty is all about Guyra
- ADE students perform well at recent Eisteddfods
- Restoration plans for Wandsworth memorial
- Demerger submission in the hands of Local Government Minister
- Drought Resilient Pasture Landscapes update
- Local community groups awarded grants totalling $20,000
- $110k boost for Arts North West
- Reboot Your Grazing with Soil Land Food
- The Slam Storm is coming to Guyra
- Takeover bid for Costa Group
- Tour council facilities during Local Government Week
- Black Mountain Final Assembly Term 2
- Ingrid in Mexico - June
- Barnaby speaks to Guyra
- Students tour Costa glasshouse
- Fiori Musicali Choir to Perform “Love and Nature” in Guyra
- Glenrac stalwart calls time
- Alternative departure gate for smaller aircraft at Armidale airport
- Marshall moves to force split of health district
- Steam trains rides returning to New England in August
- How to protect yourself and friends on FaceBook
June 2023
- St Mary’s students perform well at Cross Country
- Parliamentary Inquiry into undergrounding of transmission lines ‘welcome news’
- How Tafe Digital helped Heather’s career
- Five generations of girls
- UNE calls on farmers to share information about farm crime
- Great term of learning for Black Mountain Transition
- Care needed for wildlife during winter
- Rafters team welcomes new chef for restaurant launch
- Council welcomes rate rise decision
- Local farmers ‘gutted’ by IPart decision
- Save and Grow Guyra: Advocacy for separation from ARC nears completion
- Transition students welcomed at Bald Blair
- Black Mountain competing in Armidale Eisteddfod
- Julie celebrates 18 years with Costa
- Garden makeover about to get underway
- Memorial Park Mandala Garden underway
- Active and creative kids vouchers to be cut back
- Petition to save regional seniors travel card
- Black Mountain at Storytime
- Bald Blair PAWs Up Visit
- Karate and Punctuation at St Marys
- Guyra Men’s Shed Yard Sale
- 2023 Lions Club changeover
- Women in leadership program recognised
- CWA gather in Guyra
- Region is about to change whether we like it or not
- Pharmacist speaks out against 60-day dispensing plan
- Ron Vickress, still volunteering at ninety-seven
- Uncapped Skymuster Broadband available after successful trial
- Thunderbolt’s Cave is worth a visit
- Learning opportunity for youth in sheep industry
- Reconciliation Week Celebrations at Black Mountain Public School
- Community Choices $250k funding pool now open
- Ingrid in Mexico - May update
- Ron, still volunteering at ninety-seven
May 2023
- Seniors Mystery Outing
- Lets Kick Cancer Charity Soccer Day
- National Simultaneous Storytime at the Guyra Library
- Monthly Tingha Markets back this weekend
- New Rescue Vehicle for Guyra VRA
- High Tea Autumn Ball a hit with Seniors
- Guyra man released on bond for child abuse offences
- St Marys celebrate Catholic Schools Week
- GRIP Student Leadership Conference
- CWA member goes global
- Northern Schools Prime Lamb Competition
- Bald Blair take part in Annual Sports Day
- Diocesan Cross Country Trials
- Guyra duo shine at NSW Shearing and Wool Handling State Finals
- Ambulance targeted by rock throwers
- Regional NSW “doing the heavy lifting” as goverments push for energy reform
- Minister readies NE region for transmission consultation
- ABRI Chief steps down after 30 years
- Entertainment for Senior’s High Tea
- Retirement for ABRI Chief
- Centenary Celebrations at Bald Blair
- Proud to be part of the Shadow Ministry
- Guyra represented at CWA State Conference
- New permanent off-leash dog park for Guyra
- Mother’s Day Pamper Afternoon
- Meet Lillianna, the new Gazette team member
- Growing careers at Costa Tomatoes
- An epic two-day line-up for Big Chill Festival
- Flexing Farmers program to run in June
- Applications open for Community Small Grants
- Aileen MacDonald named in NSW shadow ministry
- Home ground upgrades for Tingha Tigers
- Black Mountain Public School Thalgarrah Excursion
- Workshops to help youngsters ‘bounce back’
- Resilient Pasture Landscapes update
- Youth week celebrations in Guyra
- Take advantage of your Vouchers before 30 June
- Wagyu Association honours Lock Rogers
- Splendid autumn day for Open Garden
- Centenary “Reveal, Seal and Launch”
- St Marys Cross Country champions
- Black Mountain Easter Hat Parade
- Creating pathways for aspiring teachers
- Cut the cost of living not the New England Budget
April 2023
- Crowds turn out for Anzac Day
- 10th Anniversary for Tour de Rocks
- Guyra’s grand fleece the supreme of show
- Establishment of Leash-Free Areas in Guyra
- Thank You Guyra
- Be wary of bitumen bandits scam
- The Sustainable House Tour 2023
- Youngsters at the Sydney Show
- Skateboarders learn new tricks
- ANZAC Day services in Guyra & Ben Lomond
- Security upgrade for Tingha Club
- Old school building on the move
- Bush fire management survey open now
- White Rock Wind Farm Community Grant Fund Applications open
- Ingrid in Mexico - birthdays, holidays and cliff diving
- Tingha markets
- Caspers kick a goal for charity
- Saturday Swaps at Guyra Community Garden
- Youth Week - ‘Connect, Participate and Celebrate’
- Tour de Rocks riders prepare to take off
- Black Mountain Public School Final Assembly Term 1
- Polocrosse Carnival a great success
- Dinner honours community service
- Design work to begin for New England Rail Trail
- Guyra Central to host Hoof and Hook Competition in 2023
- SRC raise funds for McLean Care Kolora
- ‘Art on the move’ to splash paint across the region
March 2023
- Brian Irving Memorial garden opened
- New and improved look for primary quad
- Progress Association talks housing with Costa
- Marshall returned for fourth term
- Polocrosse carnival this weekend
- Water security: what matters to you?
- Keys to the City awarded to architect Tony Deakin
- New design revealed
- Bursting to be part of the community
- 2023 Guyra Lamb Show & Sale
- Candidates in Guyra for pre-election forum
- $170,959 for ammenities at Malpas Dam
- Black Mountain Taronga Zoomobile Visit and Go Mad Leadership Program
- Another big month in Mexico for Ingrid
- High tech lids to maximise space at Landfill
- Ladies frock up for Women’s Day
- Share the Dignity this March
- Falls prevention workshop
- Guyra War Memorial Hall Land Manager
- Apiarist Industry Visit
- New owners for Guyra glasshouse
- The World’s Longest Torch Relay visits Tingha
- Bridge to go from Timber to Concrete
- Farmers reject proposed SRV
- Guyra Show - Shearing results
- Guyra Show - Woodchopping
- Costa awards funding to community groups
- Black Mountain First Assembly
- Boost for Mental Health Services
February 2023
- Town features in regional magazine
- $23,013 to turn Tenterden Hall’s white ants into dead ants
- Guyra’s inspiring Young Woman
- Diocesan Swimming Carnival
- Black Mountain Public School Show Entries
- $3000 windfall for Junior Spuds
- Sun shines on Show
- Progress Association lands cash for local projects
- Extended power outage as damaged poles give way
- Black Mountain Public School After School Activities Program
- Labor announces candidate for March poll
- GP single employer model approved for region
- St Mary’s swimming champions
- Lions Youth of the Year
- A year in Mexico for Ingrid
- Redevelopment underway at Dumaresq Dam
- Black Mountain Swimming Champions
- “Wildlife Tails" - Little Quoll
- The election is coming get ready to vote
- Golden Day for Mother of Ducks
- Royal is the right pub, in the right town
- Sunrise comes to Costa’s tomato glasshouses
- Nashos achieve coup with their book
- Welcome to the Class of 2023
January 2023
- Leading citizens honoured on Australia Day
- Funding puts watts on the roof for Guyra Sporting Shooters
- Free menstrual hygiene products for students
- Celebrate our wetlands in February
- Revised strategic documents to be included in SRV application adopted by Council
- Kayaks out exploring Malpas Dam
- Big weekend brings festival to a close
- Vale Brian Irving - ‘a true gentleman’
- Back to school vouchers
- Local craft & cooking a hit with visitors
- Volunteers left to clean up the mess - again
- Keep an eye out for pinkeye in livestock
- Golden Mother of Ducks Party
- Teenagers arrested after joyride to the coast
- Festival back after two years
- Life membership for Julie Gittoes
- Respect, reflect and celebrate Australia Day
- Costa Tomatoes launches Community Grants Program
- Increased grass fire danger for New England District
- Successful opening for CWA Art Show
December 2022
- Fireworks to bring in 2023
- Costa Tomatoes celebrates end of successful year
- Council agrees to purchase Oaky River Dam
- A DISTRACTED CHRISTMAS
- Missing Peace
- Tiny hands …
- Confidence and leadership program with Julia Spicer
- Preschoolers graduate
- Global Citizenship Ambassadors
- Choir sings for Christmas
- Lamb & Potato Festival willbe back in 2023
- Australian Dance Enterprises (ADE) Guyra Dance Recital.
- Santa and his reindeer draw crowds at Rotary Carnival
- Christmas photos popular at Rotary Carnival
- Cold spring and cool start to summer
- Electricity network maintenance scheduled for December 18th
- $250 annual travel boost for region’s apprentices and university students
- Consultation brings teachers’ voices to the fore
November 2022
- Council endorses 50 per cent permanent SRV application
- Guyra Lions Club’s Youth of the Year Quest
- ARRA members tour glasshouses
- Homes North to manage community housing in Guyra
- BUSINESS PROFILE: My Open Home Media
- Community information sessions well attended
- Additional funding to urgently fix potholes
- Walkabout Barber drops in to town
- Share the Dignity launches Christmas appeal #ItsInTheBag
- Success at Northern Schools Steer Competition
- Climate change in Guyra
- Snow Gums Learning Alliance Activity Day
- Students punch above their weight in Guyra
- What matters most to our community
- Lions Christmas Cakes now for sale
- Community information sessions to explore housing options for seasonal workers
- Guyra Family Day brings community together
- Plea to donate responsibly to the Guyra Vinnies shop
- Downed powerlines cause extended outage over wide area
- Restoration work for historic rail
- New flag for Tingha Buffalo Lodge
- Barnaby Joyce launches New England public survey
- Youngster.co to provide tech help for seniors in Guyra
- Waterfall Way could be the next Great Ocean Road
- Comedy show with a message coming to town
- Council looks to establish off lease areas in Guyra
- Black Mountain Public School Gets a Mention in Parliament
- Ban on single use plastics takes effect this week
- Out and about for Halloween
October 2022
- Bald Blair Students add their voice to New England Sings! 2022
- Celebrating 100 years of Vinnies Shops
- Christmas call out for sponsorship from CWP Renewables
- Amazing Day for our Rural Women
- TroutFest thanks you for support
- Nominations open now for 2023 Australia Day Awards
- Helicopter called to farm accident
- Big week for local Anglers
- Anglers Club Gone Fishing Day
- Thank You Guyra and Beyond
- SAGG encouraged by meeting
- Memoir - Gloria George
- Rural women’s gathering
- Police investigating missing cattle
- Education week marked at Guyra Central
- CreativiTEA returns to small communities
- Cookery committee busy planning for NSW conference
- Costa Group CEO stands down
- Lessons from Optus data breach
- Guyra Junior Rugby League Presentations & 100 Years Celebration
September 2022
- School’s out for the class of 2022
- Guyra War Memorial Hall
- SNELC welcomes new team member
- Visitor impressed with progress of Guyra Men’s Shed
- Man charged after wool bale stolen
- Bacon, eggs and conversation
- Guyra events to benefit from grant funding
- Double demerits in place from Wednesday
- Medals for service during 2019-20 fire season
- New police on the beat
- Rural health services petition tabled
- Live traffic updates extended to include local roads
- Under 16s are toast of the town
- Under 10s get the win in Grand Final
- Lane Pittman family day
- Community gets behind Trivia Night
- Colour Guyra Beautiful
- Demerger!?! – We can do this
- Home Support Services bus to provide regular access to shopping precinct
- Vale William ‘Bill’ Wicks
- Feral animals and exotic diseases Forum
- 350 rainbow & brown trout dive into Malpas Dam restocking
- New planting in time for Spring
- New beginnings at the Guyra Hotel
- Invitation to find out more about Boorolong Wind Farm
- Rural Youth Ambassadors Program
- Solar Farm agrees to $5.9 million community benefit contribution
- TroutFest nears
August 2022
- Late winter brings first snow
- New hope for council separation
- Statewide Merino Wether Challenge
- Consultation commences for proposed 50% increase to land rates
- CWA calls for improvement in rural maternity services
- Athletics success for St Marys
- Black Mountain Public School Book Week Parade
- Community groups benefit
- Community collaboration creates new street library
- Guyra Central School News
- Home Arts Day
- Cold start to bull sale season
- Bridgewater Bull Sale
- Rail Trails Bill passes Parliament
- Rally for de-amalgamation
- Guyra Central School brings home State Title
- Sara off to National Games
- Stories of drought brought together in new book
- Team Guyra riding 500km for the chopper
- Enjoyable Garden Club Winter Lunch
- CWA Bake-off
- Premier’s Spelling Bee at Guyra Central
- Aileen chosen for NSW Legislative Council
- Gazebo planned for CWA’s 90th
- GLENRAC welcomes new Sustainable Ag Project Officer
- Council appoints new Chief Officer – Corporate and Community
July 2022
- Petition demands immediate changes
- Get crafty with Jypsi
- Plans to get trains running again
- Bowlo supports locals with cash
- Signs renewed
- Outgoing farm leader sees hope on horizon
- Join a free tour of Council facilities and learn about Local Government services
- Guyra Evening CWA Celebrates Women – Wisely and Healthily !
- 90 years of CWA in Guyra
- What’s Brew’n in Guyra
- Rotary Club marks 75th Anniversary
- 10-year strategic approach to better manage water quality
- Bidding brisk at lamb sale
- What’s happening at the Guyra Neighbourhood Centre
- Turnaround strategy underpinned by 50% SRV
- Workers wanted to boost food and fibre production
- Farmers urged to attend free information evening
- Tresillian prepares to open doors to families
June 2022
- End of the road for Guyra Taxi
- Celebrating the Winter Solstice in style
- Malpas Dam wall raising project welcomed
- Exciting times ahead with formation of Guyra and Community Progress Association
- Don’t get caught by shopping scams
- Landholders asked to ensure compliance with safe storage of firearms
- $10,000 sends St Mary’s to nation’s capital
- Harding Miller Foundation Scholarship Awards Night
- Memorial Park briefing for Councillors
- Use your dine and discover vouchers before it is too late
- Country Press NSW meets with State Government over advertising situation
- Winter fishing closure in trout streams begins June 14
- Lions Club installs new President
- Reconciliation Week Celebrations at Black Mountain
- Regrowth workshop
- Council and SES teams clean up after gale-force winds
- Getting to the root of the problem
- St Marys cross country team excel
May 2022
- Wild night brings taste of winter
- Feedback needed to make region more inclusive
- Free flu jabs for all NSW residents
- Back home to start new business for Guyra
- CWA gather in Guyra
- Thank you
- Fit for Life Outreach Program
- Premier’s Debating Challenge
- Vandals target local buildings
- Barnaby wins battle for New England
- Live music and theatre this week
- Volunteers celebrated for National Volunteer Week
- Guyra progress in Bill Turner Cup
- Project Green delivers
- Let the money flow for Malpas Dam expansion in budget: Marshall
- Funding to protect koala habitat
- Fork in the road for region’s future
- Busy time for local dancers
- Joyce promises $3 million for Early Learning Centre
- Guyra home searched by Federal Police
- Relieving Deputy Principal joins team
- How do I vote if I catch COVID during election week?
- Out with the roundabout, in with a Give Way sign
- No improvement for telecommunications
- Guyra meetings sidelined by ARC
- National Family Daycare Week
April 2022
- Anzac Day 2022
- Report highlights Costa investment
- Anzac Day at Ben Lomond
- Anzac Day commemorative address
- Plans for Malpas Dam expansion formally put to water minister
- Eight candidates on ballot box for New England
- Soccer ambrose a great success
- Success for shooters
- Autumn wool dyeing workshop
- More planning reforms proposed
- Ice-rink one week later than anticipated
- Super Spuds call it quits
- Tour de Rocks rides in to Guyra Showground
- 100th birthday celebration
- Staff farewelled at Guyra Central
- Regional stages are coming alive
- Piano man to perform on Easter Sunday
- Electricity network upgrade for CBD
- Anne Starr lands judging spot at Sydney
- SES Volunteers rewarded
- Council seeks one-off Additional Special Variation
- How TAFE NSW helped Joseph
- ‘Sign up’ to support climate action
March 2022
- $234,500 for final stage of Men’s Shed
- Permanent base in Guyra for building surveyor
- Tour de Rocks heads for the hills
- Love for Lismore from Men’s Shed
- Water security key to region’s prosperity
- Guyra teen arrested
- Quality on offer at Lamb Show and Sale
- New members urgently needed for VRA
- Get back on the track for Guyra Cup this Saturday
- Parliamentary praise for Guyra Anglers Club
- Community Garden Going Gangbusters
- New educational pathways program for local schools
- Rescue Helicopter Service puts call out to volunteers
- Regional finals for Youth of the Year
- Greens candidate for New England
- Chamber Chatter - Small Business Month
- Fatal crash at Black Mountain
- Guyra Show - Junior Sheep & Wool judging
- Guyra Show 2022 Horse Events
- Lions Youth of the Year
- Fantastic Fishing Function for Anglers Club
- Polocrosse action at Bald Blair this weekend
- Calling all-rounder stock dogs!
- Guyra Show 2022 - Wool Section
- Guyra Show 2022 - Poultry Section
- New Local Environment Plan a vital tool for region
- Ice rink for Big Chill festival
- Guyra Show 2022 - Horticulture
- Big Picture CEO drops in for a visit
- $57,500 handed out at outreach event
- Bald Blair Centenary celebrations cancelled
- Guyra Show 2022 - Shearing results
- Guyra Show 2022 - Wood Chopping
February 2022
- Remarkable couple of years for Show
- $5.4m brings rail trail a step closer
- Primary Quad Mural Project
- Community outreach
- 2022 school leader
- Top agri-award for Guyra farmer
- Memorial Avenue tree planting completed
- Malpas catchment group to design new 5 year plan
- Horsemanship school a great success
- 2022 Golf Champions
- New year, new faces
- Next generation of learners begin
- $27,954 for ‘biggest and best ever’ Show
- $78,794 lighting upgrade for Guyra tennis club
- New Students, New Bike Track, New Paths, New Year!
- Pilot project to bolster the region’s aquatic centres
- New memorial plaque unveiled by Lions Club
- Making farms safer, one click at a time
- Something to celebrate
- Council sets ambitious target
- $3 million project to regenerate Ebor Falls from the ashes
- Men’s Shed looking for new members
- Great support for fishing day
January 2022
- Dianne Burey named top Citizen
- Australia Day Awards
- New shop offers healthy & sustainable products
- Vaccination rolls out for 5-11 year olds
- Learn how to arrange flowers
- Rural land values increase by 18.7 per cent
- Sam Coupland to lead council
- Australia Day activities
- CWA Art Exhibition this weekend
- Learn to dance in a fun and creative environment
- Small Halls summer tour to stop in Guyra
- Disappointed campers not happy with changes at Mother of Ducks
- Tech help for seniors launching at Libraries
- Go fishing at Malpas
- New Year, new beginnings
- Life membership for Fay Skinner
- Induction process begins for new council
- No Lamb & Potato Festival
- First COVID cases for Guyra
- Australia Day Ambassador
- Plans for Show to be bigger and better this year
- Graziers Focus on Chilean Needle Grass
- Grower’s passion for plants, people and the environment
December 2021
- Christmas Spirit shared
- Welcome fundraising boost for community groups
- January Festival back in business
- Positively different radio station
- Community brainstorms 62 ideas and creates Mother of Ducks Landcare Group
- Restrictions ease in time for Christmas
- Free diaries available for seniors
- Christmas Messages
- Class of 2021 graduates after challenging year
- Ribbon cut on $80 million investment
- Counting continues following council election
November 2021
- Stephanie Alexander Kitchen Garden Foundation – Growing, Harvesting, Preparing and Sharing
- LOCAL TRADIES SUPPORT MOVEMBER
- ADRA fills 42 bags for charity
- Important question to answer on election day How many councillors?
- Armidale Classic Car Club takes a trip
- Local Innovator features in NAB calendar
- Guyra’s sole roundabout under review
- Ben Jackson to feature on reality show
- OPINION: Local Government Elections
- Voting begins to choose new councillors
- Share the Dignity this Christmas
- First Tree Planted in Memorial Avenue
- Community encouraged to recycle household goods
- Food Pantry – three more chances to shop before Christmas
- OPINION: Vote carefully and choose wisely
- PAWS Up Visit
- Fresh faces and old standing for council
- Quartz valued at $100,000 stolen from Tingha museum
- Appeal for information after firearm stolen
- Have your say
- Putting a spotlight on Chilean Needle Grass
- Voters urged to study the form
- Early voting options expanded for local government elections
- Community to benefit from Tilbuster Solar Farm
- Sport reports November 3
- Day out for green thumbs
- First birthday celebrations for gallery
- Guyra Central School wins $5000 Smiling Mind Space and Dulux prize pack
- 2021 Wii Gaay Learning Hub
- Awards handed out
- Consultation begins on 10 year strategic plan
- Lighting up for Christmas
- CWA Evening Branch - President’s Report
- Pig Husbandry at Guyra Central School
October 2021
- Better outcomes for Mother of Ducks
- Local art on display at The Hub
- Long Service honoured
- Life Membership for Judy Wicks
- Fantastic NAPLAN results for St Marys
- COVID-19 Vaccination rates pass 90%
- TroutFest showcases our town
- Three new life members for Show Society
- Recreating Koala Habitat: a practical guide
- General Manager receives tick of approval
- Share your views on the draft LEP
- Chamber Chatter - President’s Report 2021
- Glasshouse employees vaccinated on site
- School support staff acknowledged
- Artwork shortlisted for Calendar
- Sweet treats added to the Rainbow Room
- Bald Blair School Centenary Celebrations postponed until April, 2022
- Spring mowing underway
- COVID Level 3 restrictions in place as school resumes
- New real estate opens doors
- COVID restrictions ease just in time for pool opening
- Women mean business on leadership program
- Plenty for kids to do at TroutFest
- Dye your own scarf
- Nominations closing soon for 2021 NSW Landcare Awards
September 2021
- Soup kitchen hits the spot
- TroutFest puts call out to ‘bomb’ Bradley street
- Michael Kean named Volunteer of the Year
- Clear path out of lockdown
- Perry finalist for prestigious agricultural award
- Cultural burning effective at fuel reduction
- New group formed to push for demerger
- Council REZolution puts renewable energy policy on review
- Fresh coat of paint lets murals stand out
- Murals turn drab into fab
- Excellence in family day care rewarded
- Ladies tee off for Breast Cancer
- Thanks team IGA for a job well done
- Back in the classroom after lockdown
- Groups unite to fight for return of rail
- Our History - Guyra Court House
- Lockdown lifted after five weeks
- Applications open for Black Summer Bushfire Recovery Program
- Virtual Fundraiser takes for Westpac Rescue Helicopter
- TroutFest to go ahead
- Lockdown decision expected on Thursday
- Joe’s life in words
- CWA call for urgent action on housing
- Trout stocking with a difference
- Learning in lockdown
- Our history - Guyra Tennis Association
August 2021
- Sheep Heart tribute goes global
- Community Garden Gets a Go Along
- New partnership to improve waste disposal and education for social housing tenants
- “Singing Bush” detuned
- Feedback sought on Waterfall Way upgrades
- Local company to develop region’s Catchment Water Quality Strategic Plan
- Our history - Guyra & District Cricket
- Get vaccinated Guyra
- NSW Government ignores local newspapers
- Black Mountain family flee as fire takes hold
- Baits take bite out of wild dogs and foxes
- OUR HISTORY - GUYRA GOLF CLUB
- OUR HISTORY - GUYRA BOWLING CLUB
- New manager has big ideas for Bowlo
- Stay at Home order extended
- Bald Blair Angus bulls in demand
- Armidale’s top recycling program the key to securing partnership with South America
- Landholders push back
- Time to get out and clean up the farm
- Annual land & stock returns due by end of August
- Guyra locked down as COVID spreads
- Rotary Pride of Workmanship Awards
- Education Week Activities
- Shoppers urged to comply with health orders
- Covid-19 testing now available Guyra
- Record breaking sale for Glenavon
- Bridgewater Angus tops at $20,000
- New amenities block for Tenterden Hall
- Check your letterbox for Census instructions
- Bush Fire Danger Period starts early across region
- Odd fleeces wanted by local spinner
- St Marys athletics carnival
- Science in the classroom
July 2021
- Wandsworth Hall to get new amenities block
- ‘Tildy’s Sausage Sensation’ A mother’s tribute to her daughter
- Funding for critical Child Care services in New England
- Lagoon comes to life
- Your country needs you to get vaccinated
- Demand high for face masks
- $5,636 delivers new technology for museum
- NAB to shut up shop in October
- Disappointed, sad and angry
- Business Spotlight - Khammo
- $8.7 million for Rail Trail
- Photos help secure power reliability
- Pharmacy joins vaccine roll out
- Mayor welcomes rail trail funding
- Ben Lomond says no to Windfarm
- Support strong for demerger - but more needed
- UNE and Costa team up for world-first DNA study
June 2021
- Not too late to deamalgamate
- Lions Club 50 years of service
- Rotary celebrates 75th year
- Guyra Milling changes hands
- Multicultural Public Speaking competition
- Royal Hotel wins energy saving grant
- Kolora supporting a great cause
- Street names honour airport champions
- Maples given a reprieve
- Costa hosts first Community Reference Group meeting
- Coffee, Cake & Chat at The Hub
- TroutFest baits its hooks for 2021
- Ebor’s tourist amenities to be upgraded
- Trio selected for AAGPS duties
- Winter’s playground
- Business booms on first snow day of the year
- Boost for Spring Festival
- Team Guyra in training for 500km ride
- Create your own fibre art
- Northern Schools Prime Lamb Competition
- Winter’s first cold snap expected this week
- Is Tiley set to return to ‘paradise’
- Reconciliation Week learning
- Looking at the Big Picture
- RASF Scholarship for Stephanie Cameron
- Draft budget to focus on core values and improved financial management
- Grant for Guyra Men’s Shed
- Development Application approved for proposed Guyra preschool
- Positive milestone for Malpas upgrade
May 2021
- Joseph named Student of the Year
- Firies urge residents to be winter fire safe
- Home made and happy at Silent Hands
- North West Careers Expo
- Chamber choir Fiori Musicali performs in Guyra
- Residents reject ‘Tree Change’
- Deadline extended for CBD roadworks
- Cross country Success
- On the job with Jenny Atkin
- Shearing traineeship helps fill skills gap
- Permanent application of temporary SV approved by IPART
- New shed for Lamb & Potato Festival
- Passing of local legend Ted Mulligan
- $10,000 grant for Garden Club
- Fire station Open Day
- Highway safety project starts north of Guyra
- Bald Blair back for term two
- Free Community Workshop
- Final Forum - Climate Risk Workshop Series
- New homes for Guyra Greater Gliders
- Teddy Bear’s Picnic to celebrate Family Day Care Week
- Costa Group founder dies
- Fishers invited to reel in prize-winning rainbow trout
- Feedback wanted for draft Koala Strategy
- Podiatry Chair for Kolora
- Markets set to mark first birthday
April 2021
- Anzac Day 2021
- CBD upgrade enters next stage
- Polocrosse Club back in the saddle after two years
- Chamber Choir and Country Music star coming our way
- Stock Dog ‘Challenge’ a Great Success
- Long-term permits now available for TSRs
- Time’s up on RFS career
- Waste services guide in the mail
- New process for issuing penalty infringement notices
- NBN upgrade supports local industry
- Fee rebate comes at a good time
- Lions Form It Up at Kolora
- VRA looking for new recruits
- New tanker delivered for Tingha RFS
- What we do at The Hub
- Guyra tree tops the list
- Men’s Shed on the move
- Bald Blair Public School is 100
- Free live music events for Youth Week
- The free health check every man needs
- Save & Grow Guyra forging ahead
- Workshops to help cope with climate risks
- Drachenfels takes 2021 Guyra Cup
- Tour de Cure passes through town
- Council fined for unlawfully taking water
- Need a room? The Hub can help
- Can Assist Fundraiser
- Soonchild in the saddle for Sadie’s wild ride
- One year on for Poetry Hall of Fame
- Search on for local artist to create mural
March 2021
- CWA State President visits
- New owners for local gym
- $10,000 grant to plant Memorial Avenue
- Council to donate hay to flood affected regions
- RFS celebrate new tankers and long serving members
- Sydney Writers’ Festival to be streamed at Guyra Library
- Ben Lomond Hall impacted by flash flooding
- Dams full across the Armidale region
- New UNE Study Hub officially open
- CWA members gather in Guyra
- Funding for new equipment at Preschool
- Dine and Discover now being served up
- Donate responsibly to flood-affected communities
- Now is the time to act on separation
- Funds go to Helicopter
- Fresh coat of paint for Railway Station
- ‘Stock Dog Challenge’ coming to Guyra
- Local Government elections to be held this September
- Costa Scholarship sets local student up for success
- Guyra student speaking on behalf of rural youth
- Lions Youth of the Year
- $1.037 million for local road upgrades
- $781,668 for new Showground amenities
- Telehealth counselling now available
- Get ready for your vaccination
- New phone policy has positive effects
- Camping out at Black Mountain Railway Station
- Budget review yields positive step for Council
- UPDATED: Storm hits hard
- Opportunities grow for Sara
- Amos Vale goes back to back
- $1.3 million NE Highway upgrade begins
- Council adopts new Drought Management Plan
- Now is the time to act on Malpas Dam Wall
- Meet this year’s Guyra Central School Leaders
February 2021
- Cattle stewards’ contribution recognised
- A spectacular 2021 Show
- Life Membership for Dorothy Lockyer
- 2021 Lamb Show and Sale
- Speculation around local council elections in September
- Show time this weekend
- Champions in the pool
- New manager at The Hub
- Chamber Chatter
- Small Schools Swimming Carnival
- Major take-up milestone for seniors travel card
- Northern Tablelands land values rise
- Kevin Dupé to retire
- St Mary’s is a special place to be
- Preschool needs more funds
- CBD mural decision deferred
- Nominate now for Queen’s Birthday COVID-19 recognition
- Businesses urged to register for dine & discover stimulus
- New paws on the beat
January 2021
- Guyra's top citizens recognised on Australia Day
- $63,000 ramps up access to Community Hall
- Local students enjoy taste of science
- CWA Art Show
- Spotlight on NEW Business Highland Speech Pathology
- Health Service Fun Day a smashing success
- Long service medal and citations for RFS members
- Four nominations for Citizen of the Year
- Have a fun family day out
- $3.8 million needed to remediate old Guyra Landfill
- Spuds going global
December 2020
- COVID grant delivers $985,000 for Guyra
- Rotary Christmas Raffle
- What’s happening in January 2021?
- Plans in place for COVID safe Show
- Champion volunteers honoured
- Protesters fight for change
- New Mayor and Deputy elected
- Enrolments on the rise for 2021
- Achievements celebrated
- Farewell and welcome
- Shearer training opportunity
- Bore water supply review finds Council complied with obligations
- 19 year old dies in highway accident
- Ribbon cutting for redeveloped Hub
- Schools take part in water safety programs
- Ratepayer activists demand fairness and transparency
- Submissions still open on the proposed SRV
- $20,000 for new smart boards
- Santa out and about on two wheels
- Financial reports confirm worst fears
- Fitting tribute for horse enthusiast
- Dancers take to the stage in Guyra
- "Compelling case" for Rail Trail
- No further action on hydrotherapy pool project
- Water conservation needed as temperatures climb
November 2020
- Peonies pull them in
- Separation plan for new council almost ready
- Rotary public speaking
- Have Your Say: November 25th
- Spotlight – High On Health Natural Therapies
- Honeybee Swarm Season begins
- Councillors back, but with restrictions
- Year 12 told to ‘follow your dreams’
- Guyra farmers will be the big losers
- Peony Festival set to take off
- Fibre Art the focus of new Guyra gallery
- Savings promised for forced amalgamations buried in red ink
- Bald Blair welcomes back transition
- Preschool marks NAIDOC Week
- Zooming in for NAIDOC celebrations
- Postie Bike Dash invades town
- New General Manager to start in January
- CBD powerlines set to get overhauled
- Guyra Show will go on
- $150,000 for Tingha Gems
- Crews respond to unplanned power outage
- Spotlight - JoJo’s Coffee Shop
- Join the New England Gift Card promotion
- Man charged with cattle theft following investigation
- New Mobile Phone Tower at Copeton Dam switched on
- Adopted planning statement sets clear vision for region
- Sharon’s significant contribution recognised
- Book Week Celebrations at Guyra Central
- Gold record now part of museum collection
- Smart water meters proposed for households
- Spotlight - Black Sheep Wool’’n’Wares
- Council seeks views on Special Rate Variation
- Walkers raise $2739 during October
October 2020
- Saleyard upgrades get go ahead
- Discovering science in a fun way
- Q Fever vaccination clinics return
- Garden Club introduces weekend meetings
- Will you help share the dignity?
- Essential work on local powerlines this weekend
- Explosion of colour brightens bare wall
- Awareness day powered by pink
- Push for upgrade of Guyra saleyards
- Enjoy some Halloween fun in Guyra
- Old car finds new home in car museum
- A workshop for anyone interested in wildlife rescue
- Water consumption goes on display
- Dancing through the pandemic
- Quest for Polar Bears get back in the pool
- Revised CBD speed limit for Bradley Street
- Second term as President of NSW Farmers
- Planning begins for Spring Flower Festival
- Peony Festival to bloom in November
- Squealing Piglets ride in for Men’s Health
- HAVE YOUR SAY: No windfarms on prime agricultural land
- Main street upgrade works set to restart
- Chamber Chatter
September 2020
- Inquiry into dysfunction
- Stepping up to the challenge
- Majority still want rural council
- Learning centre plans go on public display
- Planning milestone for proposed wind farm
- Spotlight on business - Burgess Garage Car Museum
- Spotlight on business - Sarah Wren
- Mural brings walls to life
- Health message with coffee
- Medallions for our WWII veterans
- Brow salon now open in Guyra
- Trampolines added to new playground
- Wartime memorabilia preserved
- New President for Guyra Chamber
- Second man charged after vehicle rammed near Guyra
- Dynamic lagoons survey online
- Spotlight on business - The Rainbow Room
- Best result for Glenmorgan
- Local student selected for rural leadership program
- Will our festival go ahead?
- Library restrictions eased
- A workaholic with a passion for plants
- Vehicle rammed and two detained
- Rotary welcomes incoming team
- Spotlight on Local Business - Hammond Plumbing & Khammo
- New leader for Tablelands Health Sector
- Hunt on for new GM as ban extended
- Bin audit identifies need for more organics diversion
- CWA takes stand against domestic violence
- Free course to identify and assist people struggling with mental health
- Vegetation program to ensure power safety
- Spotlight on Local Business - Sue Ross Real Estate
- Education Awards
August 2020
- Ben Lomond RFS celebrates
- Snow day falls short of predictions
- Water restrictions eased to level 3
- Spotlight on Local Business - BESTECH P/L & GUYRA MOWERS & CHAINSAWS
- Sports Reports August 19th, 2020
- Film Society launched
- Bridgewater tops at $10,000
- Local support drives Glenavon sale
- Bald Blair breaks records at annual sale
- Past connections prove a winner
- Operation Stock Check to combat livestock theft
- Hub expansion taking shape
- Meeting backs new Rural Council
- Community survey for learning centre design
- NAB changes opening hours
- Spark remains strong for Geoff Thrift
- Water is life!
- End of an Era for local milkos
- New gateway to Mother of Ducks
- Free webinars help prepare for future disaster events
- Catholic Schools Week
- Spotlight on Local Business – PF & JD Dullaway
- Winner claims Keno prize
- Relief for farmers with multiple holdings
July 2020
- Deano’s shines on lifestyle show
- Keno looking for $45,000 winner
- Show heading in the right direction
- Spotlight on Local Business - Kirk’s IGA
- Level 5 water restrictions will remain
- Malpas dam restocked with rainbow trout
- Scammers targeting the region
- Cattle stolen from Ben Lomond stock route
- Grandstand is something to cheer about
- Beauty Basics by Em now open
- COVID unleashes creativity
- Reverend Campbell becomes State Moderator
- Martin, Murray and Widders gone
- Coming home to Guyra
- Acting General Manager appointed
- Region set to light up
- Spotlight on Local Business - Dasha’s Hardware
- Tropical Winter Song Launch
- OPINION:Should Guyra get its Council back?
- College corner - There’s never been a better time
- Why we need to pay more for water
- Guyra’s Blue Tree
- Grandstand under construction
- Spotlight of Local Business - CT Electric
- Film nights set to return
- Ebor hatchery busy breeding trout
June 2020
- Rainbow Room here to stay
- A just reward for a helping hand
- Crafty ladies give back to community
- Police warn there are no excuses for drink driving
- The community deserves better
- Release of report fails to stem protests
- Much loved Principal retires
- Draft Budget and Operational Plan on exhibition
- Farmers filthy about rubbish charges
- Regeneration a boost to precious habitat
- Is our Lagoon at risk?
- Water sustainability number one for Costa Group
- $66,270 grant secured for Showground
- Sam White to head Angus Australia
- Council suspended and administrator appointed
- Markets and more happening
- Funding boost for hydrotherapy pool complex
- Councillor Gray calls its quits
- ‘In this together’ planting trees at Little Llangothlin
- ‘Why you need Indoor plants in your life’
- OAM for Aileen MacDonald
- Guyra Police investigating thefts
- House damaged by fire in South Guyra
- First snow day of the year
- Administration now a certainty
- Top performance from our Post Office
- Library reopens its doors
- “Be creative with your space”
- Sewing up new jobs
- Wild dog baiting program takes off
- The doors are open again!
May 2020
- Getting back to normal for pubs and club
- Two new energy projects for district
- Community survey for playground equipment
- Arrests over Guyra break and enter
- College Connections
- $400,000 expansion of ‘The Hub’ poised to start
- Minister intervenes in council dispute
- Diners welcomed back in store as restrictions ease
- Mayor welcomes additional assistance
- Rail trail decision unchanged
- Waste turned into art
- Community webinars on groundwater network
- New early learning centre for Guyra
- Whimsical and colourful store opens
- Kids get back to school as restrictions ease
- Restoration grant for historic Church
- CEO showdown in court as Minister called in
- Have your say
- Get out your Green Thumbs!
- COVID-19 Boost for NECC
- Sales hot as auctions go online
- CEO stoush on again
- Tiny toilets unveiled at rec ground
April 2020
- Candles at dawn honour ANZACs
- ANZAC services with a difference
- Crime victim thanks local heroes
- Rail trail motion deferred again
- Drive-through COVID-19 testing
- Learning continues at Black Mountain
- Drought Aid campaign wraps up
- Autumn glory in the garden
- New cafe open for business
- Council takes action on feral cats
- Monitoring bores being installed
- A different day dawns for ANZACs
- Bin audit to assess contanimation
- Poetry in motion, despite isolation
- No public services for ANZAC Day
- Calls to care for Mother of Ducks
- Learning to learn online
- Lamb & Potato Festival scores $130,000 for new space
- Growing tomatoes is an essential service
- MPS has plans in place for pandemic
- Flight lifeline needed after Qantas halts service
- A potted history of the Mother of Ducks Lagoon
- Free TAFE courses on during pandemic
- Letters to the Editor
- Man charged with multiple offences after pursuit in Guyra
- Guyra couple celebrate Platinum Anniversary
- Supermarket workers at the front line
- Historical Society needs your help.
March 2020
- A helping hand from VRA
- Council elections pushed back by 12 months
- Important Update from your local newspaper
- Be calm and stay patient, we are in this together
- St Patrick’s day fun and games
- Book and Collect from Library
- Pandemic strikes hard, forcing a new way of doing business
- Council closes facilities and offices
- MP urges community to keep it real
- Grand plans for grand old theatre
- CWA test skills at group level
- Hope Family Fun Day cancelled
- How to protect your health
- Future bright for Class of 2019
- Glitz and Glamour on the dance floor
- Lions mystery outing a hit with seniors
- Armidale Probus come up the hill
- ADRA expanding to better serve community
- Rail Trail back on the agenda
- Amazing artworks on show
- Show season starts with success at Glen Innes
- Turmoil in the ranks - moves to sack CEO
February 2020
- Show marks new beginning
- Country life suits new Anglican Minister
- Region plays critical role during bushfires
- Malpas Dam hits 50 percent
- Showgirls inspire and learn
- High speed chase ends in Guyra
- Funding boost for Ben Lomond and Guyra projects
- St Marys swimming carnival
- ‘Glimpses of New England’
- Show stopper planned for 2020
- Fundraiser planned for Hope family
- ATMs smashed, but thief left empty handed
- Turning waste into business opportunity
- Glitzy gathering coming up Seniors
- Water strategy a key step to higher dam capacity
- Appeal for cohesion to achieve Council goals
- Councillors concerns over Mayor’s leadership
- Jean Vickery named as Coffs Harbour Citizen of the Year
- Life Lessons learned in Guyra by Warrnambool Citizen of the Year
- Pamper night works wonders
- The Class of 2020
January 2020
- STATEMENT FROM ADAM MARSHALL ON COUNCIL
- Dams full but water restrictions will remain until drought breaks
- AUSTRALIA DAY AWARD FOR DOROTHY VICKERY OAM
- Hay delivery another reason to smile
- GIVIT ready to help out
- Final thank you to Frank Presnell
- Life membership for Bertha and Geoff Reeves
- Sue Adams named Guyra’s Citizen of the Year
- Who will be our Citizen of the Year?
- Train passes the test
- Australia All Over in Guyra for Australia Day broadcast
- Totems unveiled at Kolora
- Art Exhibition branches out
- Guyra Dam at 31 percent capacity following recent rain
- Lamb and Potato Festival gets underway
- Music in the street on Saturday
- Grant funds help raise the roof
- Guyra finally makes the switch to NBN
- THE Seed SCHEME to launch in Guyra
- RFS volunteers urged to register interest for assistance
- Crews from across the State head to south-east NSW to help get the power back on
- $7,700 to ensure Guyra Show goes ahead
- Leading sports presenter is Australia Day Ambassador
- Water update information sessions next week in Guyra
- Westpac Helicopter lands in Guyra on New Year's Day
December 2019
- City Santa gives to Bush Kids
- Fire on the home front
- Messages of Hope arrive for farmers
- ‘ Into the Dreaming’ resources for MPS
- New airport bore supports aerial firefighting
- Sarah thanks community ahead of tour
- Christmas arrives in style
- Graduation time for Preschool
- World’s best practice for proposed Guyra abattoir
- Bus service to make detour to Ben Lomond
- 30th Bowls Carnival underway
- Naming honour for former civic leader
- Choir prepares for Carol services
- Swim School underway
- Schools Spectacular comes to television
- Test drilling brings positive signs
- Quicker payments to assist business
November 2019
- Four words that boosted the bush
- Outstanding feat of survival
- Lions Youth of the Year
- Have your say
- Christmas party in the street
- Santa ready to roll out gifts
- Share a coffee and your ideas at a Cafe catch-up
- A gift of water for Guyra
- Australian theme for dance recital
- Have your say
- Santa’s special run this Christmas
- Total Fire Ban declared
- A hug in the box for the bush
- Amazing ladies of the CWA get to work
- Variety Postie Bike Dash stops at Bald Blair
- Kolora residents evacuated to Inverell
- Be prepared to leave
- Council bushfire measures
- 7000 hectares burnt out in Wandsworth & Llangothlin fires
- Paying tribute on Remembrance Day
- Wandsworth fire spreading towards Ben Lomond
- Red ribbon day for Gun Club
- Can Assist Melbourne Cup Lunch
- Costa expansion on hold due to big dry
- Black sheep is back with new owner
- Facelift for GALA Centre
- Tour de Rocks - on the road again
- Talented students to perform at CAPERS
- Old school friends catch up at reunion
- 2019 NSW All School Touch
October 2019
- Ready to step into the spotlight
- Students inspired by the gift of service
- New card system for water filling stations
- Q Fever vaccination program to run again
- Regional development visionaries sought
- Regional development visionaries sought
- Classifieds
- Community Noticeboard
- Sharing the Dignity this Christmas
- Year 6 camp a learning experience
- Bushfire appeal boosted by councillors
- Fun and fashions at Ben Lomond
- Painting brings back fond memories
- Leadership positions at TAS
- Diabetes experts visit Guyra
- Expo a one-stop shop for water saving ideas
- Backwater comes under fire
- Rail trail business case on track
- Smart water strategies key to business resilience
- Charity in action
- OBITUARY Gilbert White 1925 ~2019
- Visit looks at heritage rail proposal
- Drought breaking Show planned for 2020
- Home grown radio program
- Drilling underway in quest for water
- Afternoon of fashion, food and fun at Ben Lomond Hall
- Proposed changes to Armidale radio frequencies
- TroutFest a winner in tough times
- CWA helping out in the drought
- Water dispensing station at Mother of Ducks now open
- Pipeline becomes lifeline
- Test drilling for bores underway
- Wash away the drought blues
- TroutFest Fishing Clinic
- Schools out for Year 12
- Fishy weekend coming up
- Gold medal for Deano’s trout
- Think pink this October
- Stock missing from Guyra property
- Bradley St expected to reopen on Thursday
- Immediate drought assistance available in the New England
September 2019
- Rebates for residential water saving products start October 1st
- Pool opening despite the drought
- Ever seen or heard an oddgeridoo?
- Savannah set to shine at Schools Spectacular
- 1969 - A victory to remember
- Laundry popping up for rural residents
- Roadworks in full swing
- End of an era for favourite store
- Riding for Camp Quality
- Polocrosse digs deep for Sammy
- Membership drive for ratepayers association
- Open day and sale at Peterson Kelpies
- Murray re-elected as Mayor
- Emergency hay for fire affected farmers
- Deer Information Evening to explain changes
- Roadworks underway in Bradley St
- Fire chief signs off for last time
- Catching up over Scones
- One-stop shop rolling in to town next week
- Superhero Day at Bald Blair
- Grandstand gets go ahead
- Start date for CBD upgrade
- Total fire ban declared
- Father's Day breakfast at St Mary's
- New store a welcome addition
- LLS here to help
- Centenary Celebrations for Bald Blair in 2020
- NAIDOC Experience
- Council pursues SRV and harmonisation of rates
- Planting the seeds for bushfire cooperation
August 2019
- Positive results to groundwater study of Guyra area
- Start a ‘Sconversation’ on mental health
- Goodwill breakfast and gifts
- Leadership Induction Ceremony
- Guyra Gift winners
- Every Student, Every Voice
- Restricted access at Kolora due to gastro outbreak
- Inspiring ideas shine
- ‘Wyldlife’ Camp for Guyra Youth
- September start for main street
- Athletics talents on show
- Malpas pipeline in testing phase
- Country Cup Champions
- Drover’s Run raises $250,000 for Rescue Helicopter
- Avalanche of snow chasers
- Community supporting community through Community Partnership Program
- Fires claims life in Guyra
- Well deserved recognition
- OPINION: Water a hot topic for ratepayers
- Guyra well represented at NSW Farmers Conference
- Frockers flock to Ben Lomond
- Guyra Unites for Major Fundraiser
- Crowdfunding campaign launched for rail trail business plan
- Supporting our farmers
- The key to unlocking grazing systems management
- Fight to upgrade Malpas Dam goes to Canberra
- Symposium sparks cooperative path
- ‘Old Boys Day’ Fundraiser
July 2019
- Meet our latest medical recruits
- Exploring wellness in our community
- Byron Bay artist helps out the bush
- Bush fire danger period starts
- Rehydrating the soil pays dividends
- Outback adventure just days away
- Preschool sets example with water savings
- A & J Vietnamese opening
- Head on down to BottomPub for a fun night out for juniors
- Community forums for library strategy
- Frock up at Ben Lomond
- Troutfest planning underway
- GET BEHIND Guyra’s COMMUNITY projects
- Media spotlight on our town
- Talking dry times in the garden
- Oval named in Ted’s honour
- New venture for team Crop
- Sarah leads the way
- Dancers shine at Eisteddfods
- Tingha exits to Inverell
- Deputy Premier visits Malpas Dam
- Councillors divided on Guyra meetings